Introduction
This is a simple game using dice to simulate a project(what_if_you_do_not_have_dice). The primary goal is to give the players:
- a basic understanding of what goes into and comes out of an iteration
- what happens when/if you get less done that you had planned
- what happens when/if you get more done that you had planned
- provide some actual numbers to practice creating burn-down charts
Getting Started
First we need to get some preliminary data:
- ITSP = Use the stories you’ve already created and add up the total story points.
- IVG = You’ve already sequenced your stories and put them into initial “buckets”. Use the bucket size for 1-week iterations. If you don’t have a bucket size, then divide your total points by 10 and round down (this is not a general way to calculate preliminary velocity, just a way to get a number for a simulation)
We want to simulate a project either until it completes or for a fixed amount of time. We’ll start with your ITSP (Initial Total Story Points) and assume we’re going to complete IV (Initial Velocity) story points. What actually happens will be determine randomly using dice and tables (provided below).
For each iteration, we’ll use the values from the previous iteration along with some random dice values to determine what actually happened in the given iteration. We’ll keep doing this until you “run out of story points” or time runs out. What we’ll be calculating is:
- Actual velocity versus what we predicted
- Number of story points added or removed
- Changes to estimates on existing story points.
After that, we’ll make a few graphs to track the progress of the project.
Finishing
If during any iteration your total remaining story points is < half of your predicted velocity, then you can assume you finished during that iteration.
Tables
Iterations 1 - 2
| Actual | Roll | Change | Story | Roll | Change | +/- Story Points |
| Velocity | 1 | -3d6 | Points | 1 | -3d6 | Roll 1 = 3d6 |
| equals | 2 | -2d6 | Added | 2 | -2d6 | Roll 2 = 3d6 |
| IVG | 3 | -1d6 | or | 3 | -1d6 | Change = Roll 1 - Roll 2 |
| +/- | 4 | +1d6 | Removed | 4 | +1d6 | can be |
| –> | 5 | +2d6 | –> | 5 | +2d6 | positive |
| 6 | +3d6 | 6 | +3d6 | or negative |
Iteration 3 - 5
| Actual | Roll | Change | Story | Roll | Change | +/- Story Points |
| Velocity | 1 | -2d6 | Points | 1 | -3d6 | Roll 1 = 2d6 |
| equals | 2 | -1d6 | Added | 2 | -2d6 | Roll 2 = 2d6 |
| IVG | 3 | -1d6 | or | 3 | -1d6 | Change = Roll 1 - Roll 2 |
| +/- | 4 | +1d6 | Removed | 4 | +1d6 | can be |
| –> | 5 | +1d6 | –> | 5 | +2d6 | positive |
| 6 | +2d6 | 6 | +3d6 | or negative |
Iterations 6 - 9
| Actual | Roll | Change | Story | Roll | Change | +/- Story Points |
| Velocity | 1 | -2d6 | Points | 1 | -1d6 | Roll 1 = 2d6 |
| equals | 2 | -1d6 | Added | 2 | -1d6 | Roll 2 = 2d6 |
| IVG | 3 | 0 | or | 3 | 0 | Change = Roll 1 - Roll 2 |
| +/- | 4 | 0 | Removed | 4 | 0 | can be |
| –> | 5 | +1d6 | –> | 5 | +1d6 | positive |
| 6 | +2d6 | 6 | +1d6 | or negative |
Iterations 10+
| Actual | Roll | Change | Story | Roll | Change | +/- Story Points |
| Velocity | 1 | -1d6 | Points | 1 | -1d6 | Roll 1 = 1d6 |
| equals | 2 | -1d6 / 2 | Added | 2 | -1d6 / 2 | Roll 2 = 1d6 |
| IVG | 3 | 0 | or | 3 | 0 | Change = Roll 1 - Roll 2 |
| +/- | 4 | 0 | Removed | 4 | 0 | can be |
| –> | 5 | +1d6 / 2 | –> | 5 | +1d6 / 2 | positive |
| 6 | +1d6 | 6 | +1d6 | or negative |
Example
Iteration 1
- Remaining Story Points = 65 (what we started with)
- Velocity = 10 (guess - or based on planning poker)
Actual Velocity
Roll 1d6 –> 6. The table says add 3d6 (rolled 14) Actual Velocity = 10 + 14 –> 24 (we completed 24 story points)
Story Points Added/Removed
Roll 1d6 –> 5. The table says add 2d6 (rolled 9), so we added 9 more story points of work
Changes to Estimates
Roll 1 = 8, Roll 2 = 7, Change = 8 - 7 –> +1
Story Points Remaining
Initial = 65 - completed (24) + points added/removed (9) + Changes (1) –> 51 points
Iteration 2
- Story Points Remaining = 51
- Velocity = 24 (from iteration 2)
Actual Velocity
Previous = 24, Roll = 2, -2d6 (9), actual velocity = 15
Story Points Added/Removed
Roll = 6, +3d6 (8)
Changes to Estimates
Roll 1 = 9, Roll 2 = 7 –> +2
Story Points Remaining
Initial = 51 - completed (15) + points added/removed (8) + changes(2) –> 46
Iteration 3
(Note we use new tables)
- Story Points Remaining = 46
- Velocity = 15
Actual Velocity
Roll 1d6 (5) –> +1d6 (1) –> 15 + 1 –> 16
Story Points Added/Removed
Roll 1d6 (3) –> -1d6 –> -4
Changes to Estimates
Roll 1 (2d6) = 10, Roll 2 (2d6) = 12, Roll 1 - Roll 2 = -2
Story Points Remaining
Initial = 46 - completed (16) + points added/removed (-4) + changes(-2) –> 24
Iteration 4
- Story Points Remaining = 24
- Velocity = 15
Actual Velocity
Roll 1d6 = 1 –> -2d6 (4) –> 15 - 4 –> 11
Story Points Added/Removed
Roll 1d6 (1) –> -2d6 (-9)
Changes to Estimates
Roll 1 = 17, Roll 2 = 8, 17 - 8 = 9
Story Points Remaining
Initial = 24 - completed (11) + points added/removed(-9) + changed(9) –> 15
Iteration 5
- Story Points Remaining = 15
- Velocity = 11
Actual Velocity
Roll 1d6 (4) –> +1d6 (6) –> 17
Story Points Added/Removed
Roll 1d6 (3) –> -1d6 (-5)
Changes to Estimates
Roll 1 = 15, Roll 2 = 12 –> +3
Story Points Remaining
Initial = 15 - completed (17) + points added/removed (-5) + changes(3) ==> -4 (we finished!)
Example Summary
| Iter# | Est. Velocity | Actual | Beg. SP | Added SP | Estimate Changes | Ending SP |
| 1 | 10 | 24 | 65 | 9 | 1 | 51 |
| 2 | 24 | 15 | 51 | 8 | 2 | 46 |
| 3 | 15 | 16 | 46 | -4 | -2 | 24 |
| 4 | 16 | 11 | 24 | -9 | 9 | 15 |
| 5 | 11 | 17 | 15 | -5 | 3 | -4(0) |
Velocity Graph
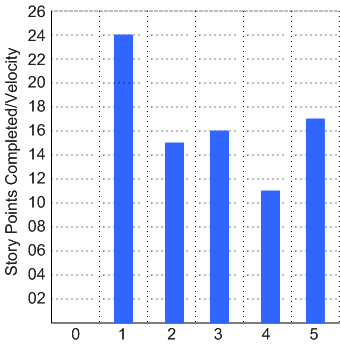
A velocity graph charts velocity over iterations. You can use it to:
- Estimate future velocity based on previous iterations
- Average of past three
- Worst three
- Best three
- Research drastic changes
- See if the project is stabilizing or not

Burn-Down Chart
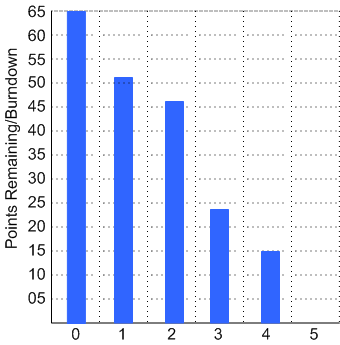
Iteration to iteration, how is your project progressing to completion? The burn-down chart gives you an idea of what is happening on your project.
- If there is a gradual decline, you can use it to project end times.
- If it wildly fluctuates, you probably need some controls on the user stories going on
- If it seems there is a discrepancy between how much work is getting done and the chart, it might suggest hidden work or work that is just not being considered as part of the overall effort

Story Points Completed
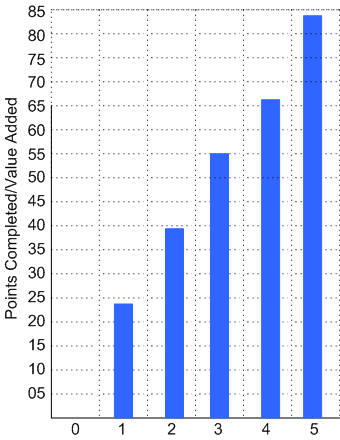
This is another way to look at work. In this case we’re looking at the work completed, rather than the work remaining.

- If the slope of this graph is very different from the reverse of the slope of the burn-down chart, that indicates that there was some amount of churn in stories, either the adding or removing stories, or the estimates

Comments